Where attribution and reality disagree.
Channel by channel. The slider below lets you change the threshold for declaring a gap meaningful. Drag it and watch the labels recompute live.
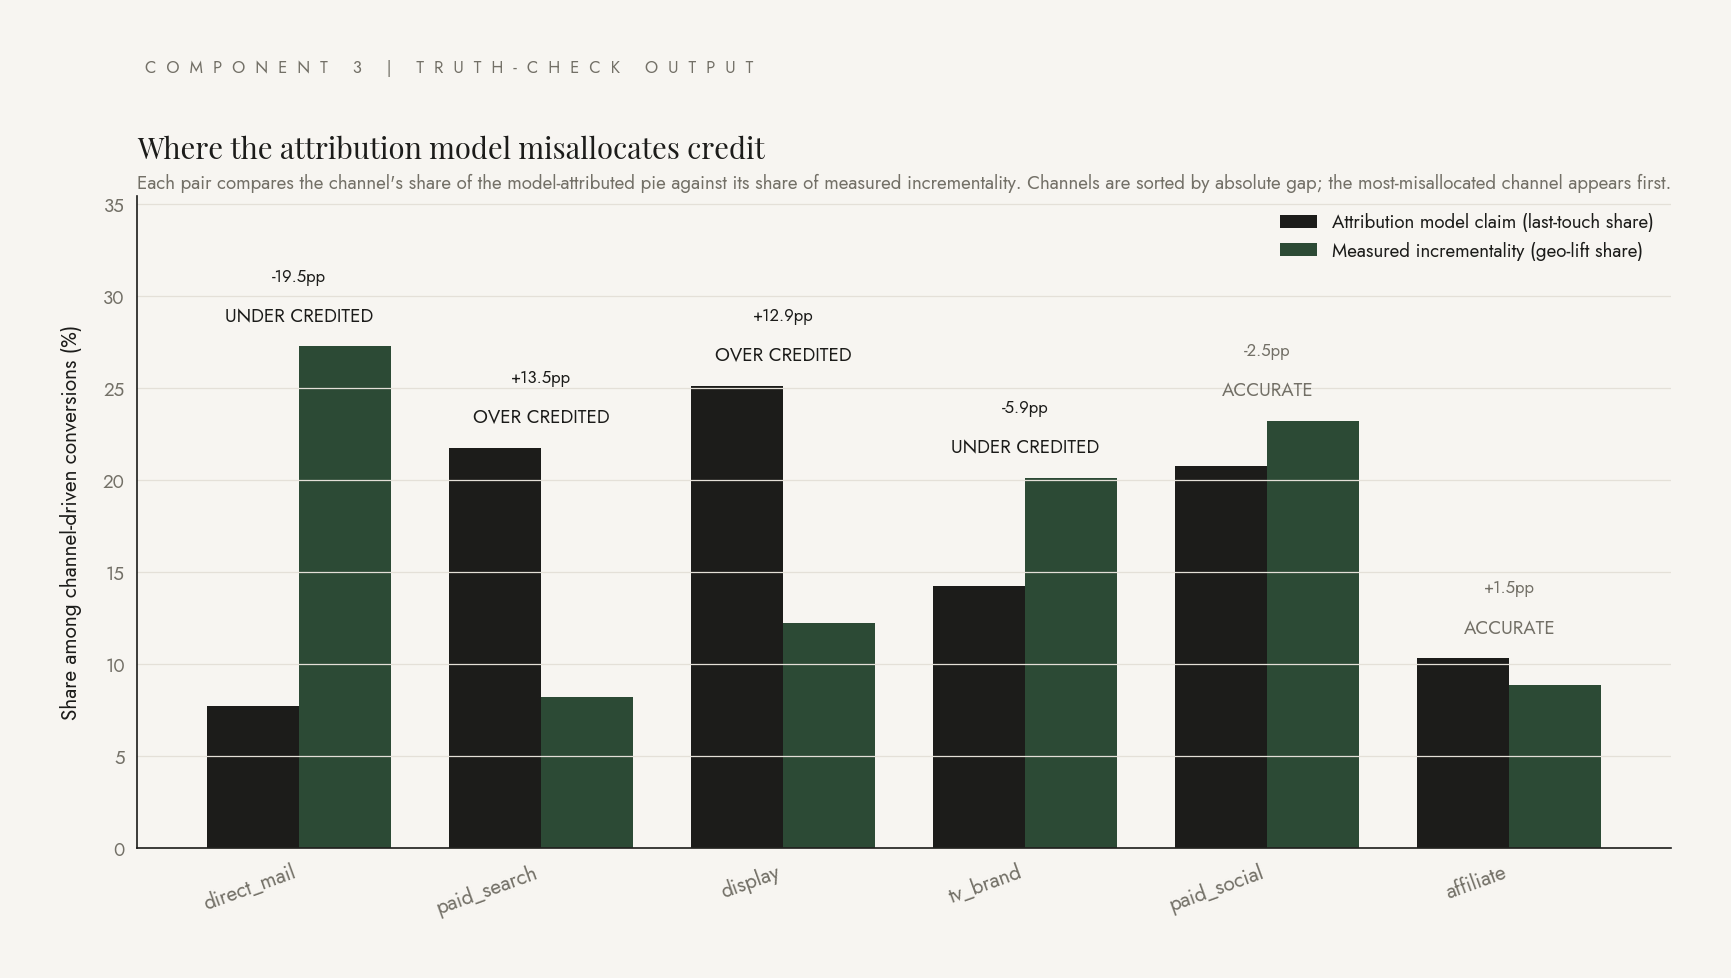
This is the headline of the entire project. The charcoal bars in the chart below are what the attribution model claims each channel contributed. The forest-green bars are what we measured actually happened, using the geo-lift engine on the previous page. The number above each pair is the gap, in percentage points.
The comparison is on shares, not absolute conversion counts. Last-touch attribution attributes nearly all conversions to channels because it has no concept of baseline conversions. In absolute terms, every channel looks over-credited by 2 to 5x. The interesting question is which channels are relatively over- or under-credited compared to their actual causal contribution. That is the slice the truth-check exposes.
Below the chart is the interactive part. The default threshold is five percentage points: if the gap between model claim and measured share exceeds that, the channel gets flagged. Drag the slider to see how the labels recompute. Notice that as you raise the threshold, channels that were borderline drop into the "accurate" bucket. As you lower it, more get flagged. This is the kind of decision you would actually make in production: where to draw the line between noise and real misallocation.
Static comparison: model claim versus measured incrementality
Try the slider
The labels in the table below recompute every time the slider moves. The metric tiles roll up accuracy and macro-F1 across 300 simulated predictions at the chosen threshold.
| Channel | Model share | Measured share | Gap | Label at this threshold |
|---|---|---|---|---|
| Loading comparison data… | ||||
Channels sorted by absolute gap, largest first. The accuracy and macro-F1 tiles are computed across 300 simulated predictions at the chosen threshold; this lets you see how a different decision boundary would change the validator's classification metrics on held-out runs.